I don’t like not knowing how something works, so I just had to dig further into how Astoria services see requests for queries versus Updates, Deletes and Inserts.
In my previous post, I dug into the assembly with reflector and could see that a PUT was used for updates, DELETE for deletes and POST for inserts.
I turned tracing on for the Astoria service and pushed the trace info to a log file. You can see how to do that at the end of this post.
Looking at the messages, you can see the METHOD and the query operators but not the main call. 🙁
For example if I made a call to service.svc/Customers the message looks like this. I’ve stripped out WebHeader information from the message.
<HttpRequest xmlns=”http://schemas.microsoft.com/2004/06/ServiceModel/Management/MessageTrace“>
<Method>GET</Method>
<QueryString></QueryString>
</HttpRequest>
I don’t see that I called the Customers “operation”.
If I request service.svc/Customers[52], it’s the same. I don’t see the Customers and I don’t see the ID i’ve passed in.
If I use a query operator as in service.svc/Customers[City eq Seattle], it’s still not exposed. Now I’m getting frustrated. I know I’ll have to dig deeper at some point, or bribe Pablo to show me someday.
But for now here’s a little gratification. If I create my own Service Operation which takes a query string, now there is something to see. My service operation is CustomersbyCity. the call looks like this
service.svc//CustomersByCity?city=London
The message looks like this
<
HttpRequest xmlns=”http://schemas.microsoft.com/2004/06/ServiceModel/Management/MessageTrace“><Method>GET</Method>
<QueryString>city=London</QueryString>
</HttpRequest>
When I use my little console app as a client and do some inserting and deleting, I can see the methods coming up the pipe, remember, the Astoria.Client.dll translates the function (insert/update/delete) into a Method.
<
HttpRequest xmlns=”http://schemas.microsoft.com/2004/06/ServiceModel/Management/MessageTrace“><Method>DELETE</Method>
<QueryString></QueryString>
</HttpRequest>
So, only MILDLY interesting to me (because I can’t get in deep enough yet) and probably COMPLETELY uninteresting to most everyone else. But it was fun digging around and also learning how to use some of the WCF tool. Here by the way is how I got to see the messages.
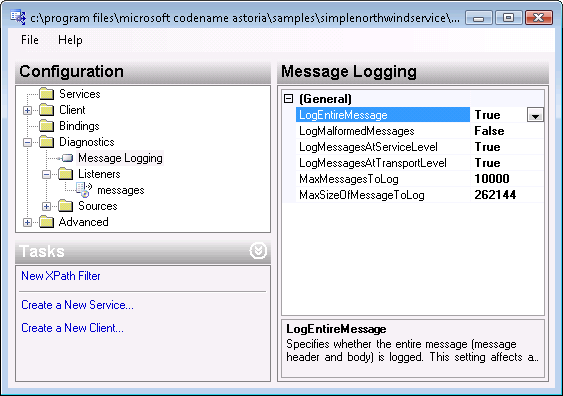
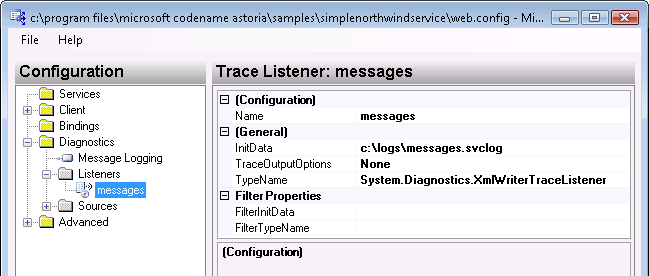
Modify the web.config to “Turn On” tracing and messaging. You can do it manually or with a tool.
<system.diagnostics>
<sources>
<source name=“System.ServiceModel.MessageLogging”>
<listeners>
<add name=“messages”
type=“System.Diagnostics.XmlWriterTraceListener”
initializeData=“c:\logs\messages.svclog” />
</listeners>
</source>
</sources>
</system.diagnostics>
<system.serviceModel>
<diagnostics>
<messageLogging logEntireMessage=“true” logMessagesAtServiceLevel=“true”
logMessagesAtTransportLevel=“true” />
</diagnostics>
</system.serviceModel>
You can use the WCF Config tool in Visual Studio 2008 to configure this. Right click on the web.config and choose Edit WCF Configuration. Here are screenshots of the settings that created the above in my web.config.


If you are using the Web Dev server, you need to stop that server so that the trace actually gets written to the file before you can look at it.
Once the file is created, you can look at it using the Service Trace Viewer which you can find in the SDK Tools (available from Start/Program Files/Microsoft Windows SDK for Visual Studio).
![]() Sign up for my newsletter so you don't miss my conference & Pluralsight course announcements!
Sign up for my newsletter so you don't miss my conference & Pluralsight course announcements! ![]()