I have been bitching for a while about the loss of the debugger’s ability to drill into a dataset/datatable in the same way that we could in VB6. There is even a project (I have yet to look at…sorry) on GotDotNEt to make up for this.
I have been told – just wait, visualizers will help!! But the Whidbey PDC bits did not have everything necessary. The new bits (VS2005 March Preview) do. And there are two great articles on using them. One is in Scott Nonnenberg’s weblog and the other is an article by Morgan Skinner in the current MSDN Magazine, which also explains DataTips and the totally awesome DebuggerDisplay attributes.
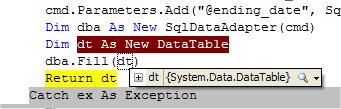
Before I get to Visualizers, I want to point out datatips if you haven’t seen or heard of them quite yet. DataTips are very much like QuickWatch, except they are available by hovering over the object you want to get information on. In general, debugging has been greatly improved for ado.net objects. In .NET 1.0 and 1.1, when you used Watch or QuickWatch to drill into a datatable, you could see how many objects were in the columns collection or rows collection, but you could not inspect those objects without explicitly typing that object (eg: mytable.columns(1)) into the debugger you were using. Now you can open up the datatable, and keep drilling in, right into the column and other objects to see the properties. Here is what that looks like using the datatips instead of QuickWatch, but the effect should be the same:
1) hover over object and datatip will popup up (note the plus sign is for the datatips, the spy glass is for visualizers)
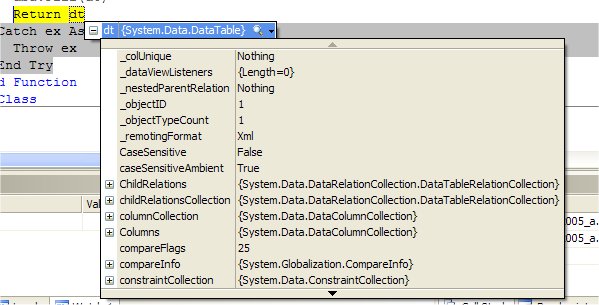
2) clicking on the plus sign exposes the structure of the datatable which is similar to what we see in 1.0/1.1
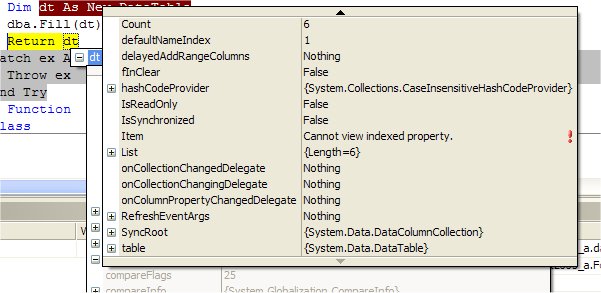
3) clicking on Columns is just basic info on the collection, again, not new yet…
4) Finally I have selected list (the dimmed window behind), which shows the guts of the array that makes up the collection and from there, I selected items and …voila, here are the individual data columns. You can see that I can continue into them from here if I wanted.
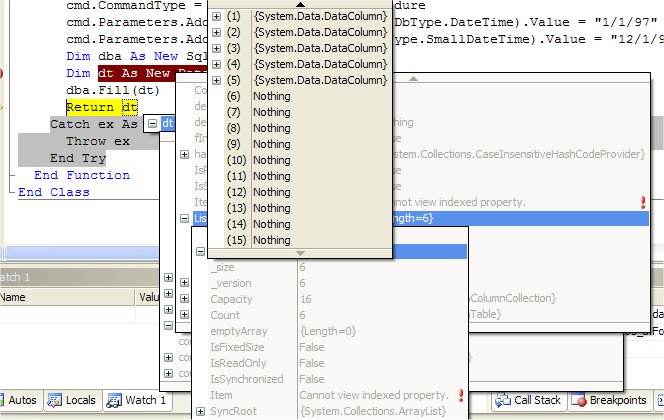
So this is where I will want to go do something with an inherited datatable class that uses debuggerdisplay attributes so that I can see something useful. Instead of
“(1) System.Data.DataColumn“, I’d MUCH rather see the name of the column.
But, not this weekend! Instead, what I did today (in C# no less and here’s the proof…)
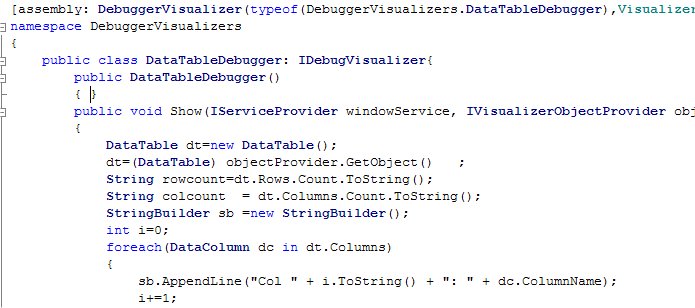
was write a visualizer that quickly exposes the info I am most often looking for quickly from a datatable. How many rows, how many columns and what are the names (and positions) of the columns.
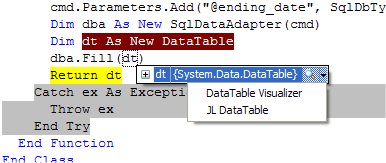
Here is my visualizer in action. You will notice that there are two of them here. One is a pre-written visualizer that was included in the install. It displays a simple grid of the actual data – the other most obvious thing I would be looking for. The second is the one I wrote.
And here is what you get when clicking on mine (JL DataTable)
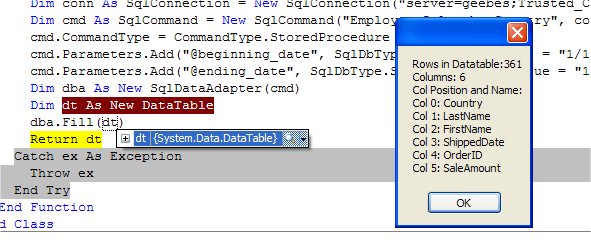
This is just the beginning – a few experiments. I only used a little messagebox. Imagine creating a gridview and populating it with the properties of datatable the way you want to see them and then drilling into the various properties, methods, collections that are exposed.
I like that idea!
I am even more excited about the debuggerDisplay attributes. I saw that at PDC (Kit George’s BCL talk) but he wasn’t using PDC bits and I spent a lot of time trying to get that to work in VB or C#, before I was finally told that I needed to wait for new bits. So those are here now, too. Whoopee! Morgan’s MSDN article gives a really great first look at the DebuggerDisplay and only your imagination (and some completely locked up classes) will stop you.
![]() Sign up for my newsletter so you don't miss my conference & Pluralsight course announcements!
Sign up for my newsletter so you don't miss my conference & Pluralsight course announcements! ![]()